There was approximately an 80-year divide between the start of the Great Depression and the Great Recession. It has only been an eighth of that time since the 2007 crash and America is finding itself right back where it was in regard to the size of debt.
The cause for the Recession was the home loan industry, along with porous policies put into place by the Clinton Administration and kept in place and encouraged during the Bush Administration. Subprime mortgage lending, which was lending to people with bad credit, brought this massive fall. It is what they call the bubble and, as the following graphs show, it burst with a bang.
The banking industry, which provided all those bad loans, soon joined in the rubble. From Oct. 1, 2000 to Feb. 1, 2007, only 24 banks closed. From Feb 2, 2007 to Dec 19, 2014, 510 banks closed.
In 2008, the total number of households was 116 million. Their total debt was $12.68 trillion.
As of the end of 2016, the total number of households has risen to nearly 126 million. According to MarketWatch, as of March of this year, the household debt was at $12.73 trillion. The real difference, however, is that 41.3% of that debt is held by households with excellent credit compared to 33.9% in 2008 and 23.7% in 2003. Another positive is that most of the debt, around 80%, is held by households with at least good credit.
Breaking it up according to the two numbers provided (126 million and $12.73 trillion), the average household would be carrying nearly $101,000 in debt. That looks pretty astronomical, but the number is actually higher. It’s $135,924, according to NerdWallet, the financial planning and financial tool website.
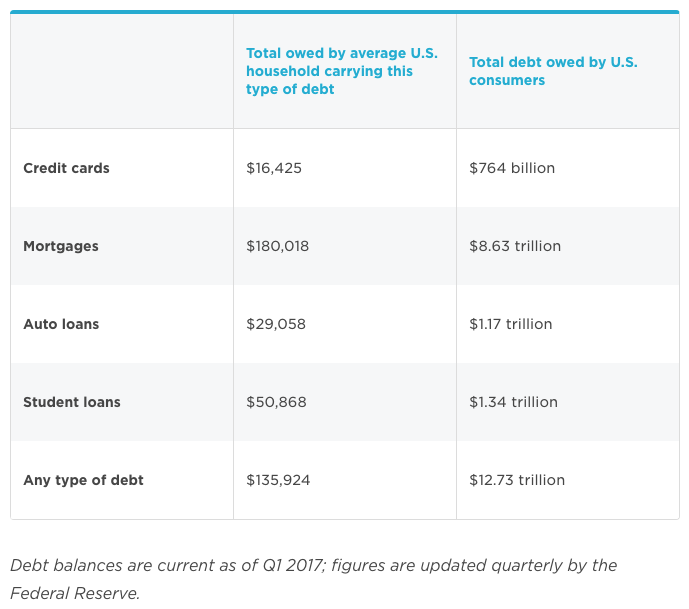
Image from NerdWallet.com.
NerdWallet also pointed out that despite the lesson learned 10 years ago about the problem with massive debt, it appears to not be a lesson remembered. Americans have increased their spending by 11% over the past decade. Much of this debt stems from mortgages and student loans.
This isn’t to say that debt is a bad thing. Debt, if being paid off, is the only way to receive more credit, increase the credit score, and be more apt to receive big loans for cars and houses with lower finance rates. Debt is used to develop credit, and credit represents trust. Trust that the debt will be paid. The credit score is “trust” numerically spelled out.
During the housing boom, this trust was misplaced and America, and the world, felt the affects of it. Now this trust has been misplaced again. Not in the areas of mortgage, credit card, or car loan debt, but student loan debt, which currently stands at $1.44 trillion.
STUDENT LOANS AND CREDIT SCORES
The reason the Great Recession took place was because of loans secured through bad credit. The student loan debt crisis is due to students securing loans with practically no credit. The vast majority of students attending college are, as expected, between the ages of 18 and 24. Upon graduation, they walk out with a degree and an average debt of more than $37,000.
Now consider the credit scores of these current students. According to Experian, which is one of the nation’s three major credit bureaus, the average credit score for people between 21 and 34 is 634. The average for people 20 and under is 631. Below 630 is considered “poor” and a far cry from “good”, which begins at 690.
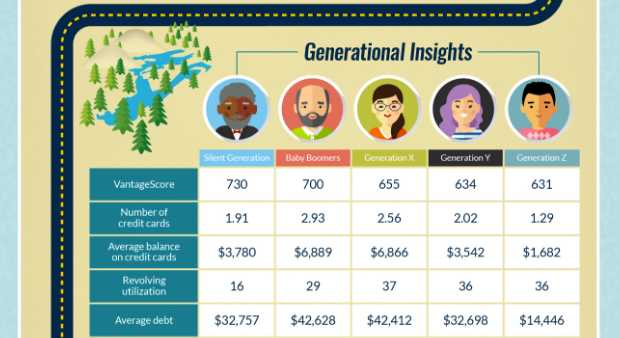
Image from Experian.
It is interesting that these groups are starting on the fringe of bad credit and then taking on $37,000-plus worth of debt. But, as aforementioned, debt creates credit and credit means trust. If someone has $37,000 worth of debt and is paying it off, then the credit score cannot go anywhere but up.
The question is, “Are these student loans being paid?”
TRANSPARENCY AND THE COLLEGE SCORECARD
 Image from CollegeScorecard.ed.gov.At the start of 2013, the Department of Education began issuing the College Scorecard, which was developed for parents and students to compare schools—public, private nonprofit, and for-profit.
“The College Scorecard provides a snapshot about an institution’s cost and value to help families make smart decisions about where to enroll,” stated then-Secretary of Education Arne Duncan in a Department of Education press release.
The value Duncan mentioned indicated “gainful employment”, which is a term that references whether a school is really worth going to or not. If a student pays $40,000 for a degree that doesn’t help them get a good job, then that data is displayed as a value.
The regulations were primarily directed toward for-profit colleges, in particular, online colleges that tended to target “at-risk students”. Before these regulations were put into action, “at-risk students”—students who had never performed well in the education system and were unlikely to be accepted into public or private institutions—were lured by the idea that they could finally get a degree and move on toward a better career. President Obama called some of those institutions what they were: “bad actors”.
Many of the “bad actors” closed their doors. Other for-profit schools had to deal with the heavy regulation, which made their profits dwindle despite providing a solid education. This helped the “at-risk students” make wiser choices, and provided more information all around.
A SCORECARD “CODING ERROR”
Another aspect of the College Scorecard was presenting the repayment rates of student loans based on 1-, 3-, 5-, and 7-year time periods. The Scorecard had been showing that more than 60% of students were paying back their loans, with private nonprofit schools reaching almost 80% repayment, but the for-profit schools averaging about 50%.
On Jan. 13, one week before the Obama Administration transitioned out for the Trump Administration, Assistant Secretary of Postsecondary Education Lynn Mahaffie issued a statement informing the public that “the Department found a coding error in the calculations for repayment rates”, but that “over 90% of institutions on the College Scorecard tool did not change categories (i.e., above, about, or below average) from the previously published rates.”
Nothing had changed? More than 90% accurate? Then there was no need to worry when those rates would be republished. She was accurate about the “categories” not changing. What did change were the rates, and these changes were significant as the following charts clearly indicate.
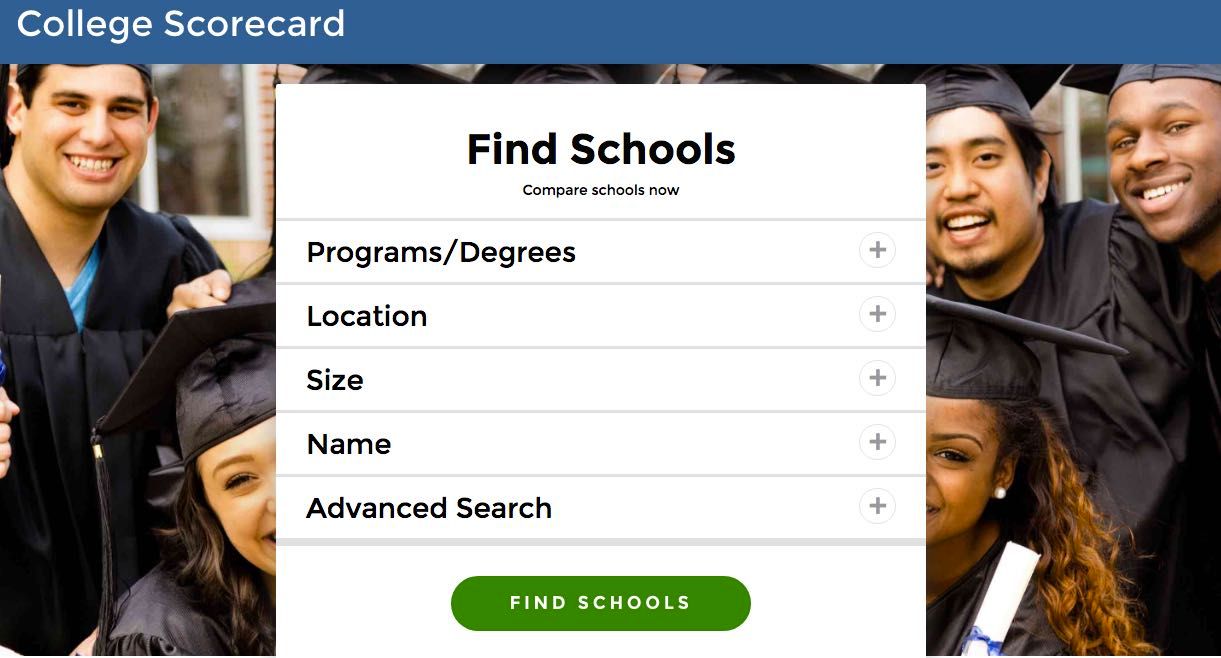
Image from Department of Education.

Image from kelchenoneducation.wordpress.com.
According to The Wall Street Journal’s investigation of the error, the Department had “inflated the repayment rates for 99.8% of all colleges and trade schools in the country.”
After much ado, this answers the question. No, apparently most students are not paying back their loans, based on the “All Colleges” section of the College Scorecard.
Furthermore, there are currently more than 42 million student loan borrowers. Of these 42 million, there are 27.8 million currently being required to pay their loans back. Of these 27.8 million, 12.1 million are either in deferment, forbearance, default, or in a grace period with their loans. According to a report in Time Money, of that 12.1 million, there are 8 million who have defaulted on their loans, which means they have not submitted a single payment in 270 days. This has left about $137 billion in default.
DO DEFAULTS EQUATE A DECREASE IN STUDENT LOANS?
According to the Federal Reserve, there continues to be a massive increase in the balances of student loans. Over the past five quarters, the student loan balance has increased by $114 billion (the summer quarter, Q2, being exempted). Comparatively this past quarter, mortgage balances increased by 1.7%, which was nearly 1% less than the student loan balances (2.6%). This has been the trend as of late, where student loan balances have been outpacing every type of debt, including car loans and credit cards. The downside isn’t that debt is being accrued. The downside is that many students aren’t paying these loans back.
The current delinquency rate for mortgages, car loans, credit cards, and student loans, respectively are as follows: 1.7%, 3.8%, 7.5%, and 11%. In fact, the student loan delinquency rate has continued around the 10% mark for the past five years, according to the Fed.
Despite the increase of defaulting loans and the hundreds of billions of dollars not being paid back, student loans are continually granted at an increased pace. Since more than 90% of these student loans are federally funded, perhaps the government could come up with an idea of how to curb these defaults; especially since these federal student loans require either no credit checks (Stafford and Perkins loans) or extremely limited credit checks.
It is commonly believed that federal student loans cannot be discharged through filing bankruptcy. That isn’t completely true. Former students can file for bankruptcy, but it isn’t the same as typical individuals who file for bankruptcy based on credit card debt, mortgage debt, or other accumulated debt. Even people who successfully file for bankruptcy, their student loan debt remains intact. The fact is filing for bankruptcy on student loans adds difficulty to an already very difficult process. If a student files for bankruptcy and wants their student loan discharged as well, they must file a separate “adversary proceeding”.
STUDENT LOAN FORGIVENESS OPTIONS
The Obama Administration did begin instituting several methods of discharging loans through four Federal Student Loan Forgiveness programs that will discharge loans after 20 or 25 years of consistent repayment. These programs are called income-based repayment, income-contingent repayment, Pay As You Earn, and Revised Pay As You Earn. There are also three others based on career choice called Public Service Loan Forgiveness, Teacher Loan Forgiveness, and Perkins Loan Cancellation, all three of which require no less than five years of continual full-time work in the specified career and consistent payment.
These options, however, do not change the fact that approximately 60% of students are not even getting through year three without defaulting. In fact, they may act as an incentive for students to continue racking up debt in hopes of a brighter future. A debt of $37,000, however, doesn’t appear very bright.
It is obvious the federal government is not going to simply forgive nearly $1.5 trillion in student loans, nor should they. This does not mean that some students haven’t been duped, especially by for-profit colleges, known as degree mills (these types are not the Strayer, Phoenix, or DeVry’s of the online college world); but those account for a drop in the bucket in the massive expanse of student loans. For those reasons, the Obama Administration justifiably, though haphazardly, placed strict regulations across the college landscape.
IF STUDENTS DON’T PAY, WHO WILL?
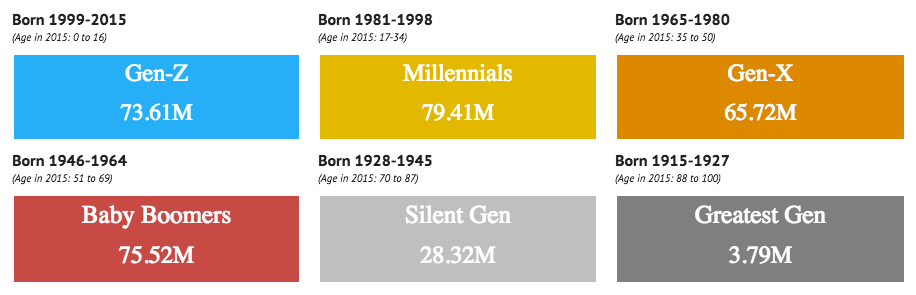
FICO recently released good news regarding the average credit score of Americans. It is 700, which is the highest it has ever been. As aforementioned, that average wasn’t due to the credit scores of the 34 and under crowd with their 634 and 631 averages. No. The reason why the average is so high is because the Baby Boomer and the Silent generations have such high scores: 700 and 730, respectively. These two generations account for about 104 million, while Millennials and Gen-X (credit score average of 655) account for about 145 million.
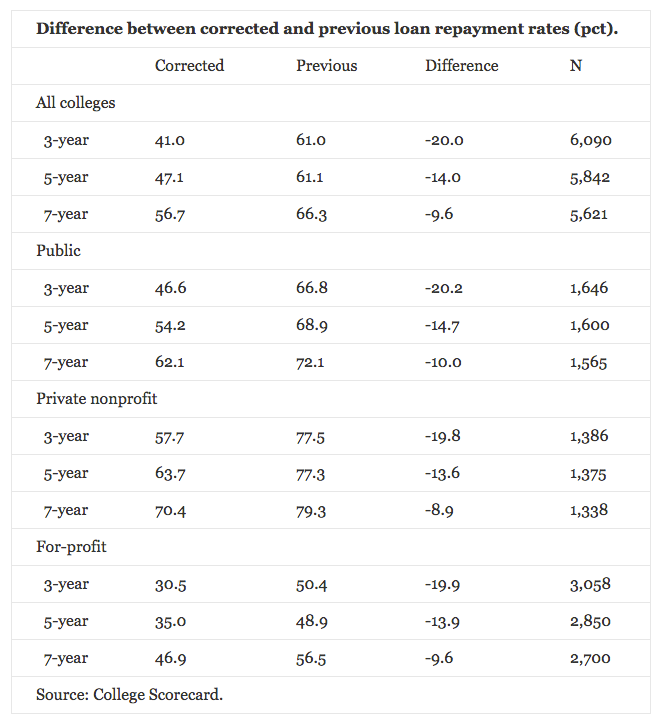
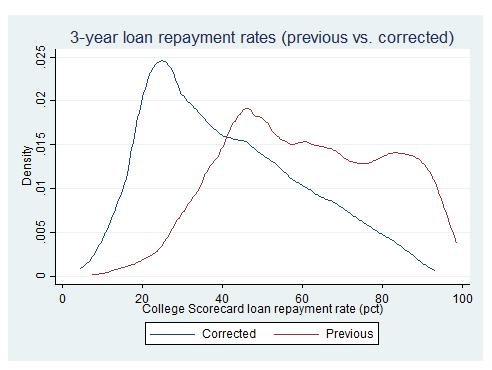
Image from Knoema.com.
It seems the answer is rather obvious. The Baby Boomer and Gen-X generations appear capable of footing the bill, and so enters the Parent PLUS program.
The Parent PLUS program began in 1980 and was intended for middle- to upper-middle class parents to take out loans to help their kids enter or finish college. As of recent, however, the restrictions for acquiring a Parent PLUS loan have been loosened dramatically.
In 2011, the Obama Administration decided to tighten the credit controls because it was evident parents were struggling to pay back the loans. The sudden credit requirements caused tens of thousands of loan requests to be denied, therefore forcing many students to dropout of college.
A backlash ensued, which led to continuous lobbying from representatives of historically black colleges, minority groups, the Congressional Black Caucus Education Task Force, and representatives of the Thurgood Marshall College Fund. Groups demanded the restrictions be loosened. In October of 2014, the Administration announced it would relent and loosen the standards, but would not implement them until the following year. The lobbying groups demanded an immediate loosening of the standards.
Johnny Taylor, then-president and CEO of the Thurgood Marshall College Fund, compared the delaying of loosening the restrictions to “our government issuing a statement indicating they have a cure for Ebola and then announcing the cure will not be released until July 2015.”
PARENT PLUS: A “HORRIBLE PROGRAM”
Once the restrictions were removed the following year, Taylor stated that Parent PLUS was a “horrible program” and “totally out of control.” The loosened restrictions allowed approximately 370,000 borrowers to receive loans that would have otherwise been denied due to bad credit.
Taylor was hyperbolic in his “Ebola” statement, but was accurate about the program itself. It is a horrible program due to its high fixed interest rates (currently 7%) that can reach 10.5%, no cumulative loan limit, and eligibility not depending on credit score nor debt-to-income ratio. To put the alarming reality into a more clear perspective, consider this: the Parent PLUS loans are now open to parents below the poverty line as well as those heading into retirement with no savings.
The intent of loan acceptance, however, seems to be a play on guilt for parents who wish to help their child attain a college degree. By applying for Parent PLUS loans, parents are typically saddled with debt anywhere between $25,000 to $40,000, and that doesn’t include their current debt, which could include a mortgage, car loan, and credit card debts. Parents, even those with good credit, run the high risk of bankruptcy or at least lowering their credit score dramatically in case of default or delinquency.
It is apparent that parents from all ranges of credit scores and income classes are applying and receiving these loans. In fact, more than 3.5 million parents have taken out Parent PLUS loans accumulating nearly $80 billion. A recent article by The Wall Street Journal reported that the default rate of Parent PLUS loans (more than 10%) exceeds that of the mortgage crisis at its peak. Along with the default rate, there are approximately 5% of borrowers who are delinquent.
Unfortunately, none of the default or delinquency rates have put a damper on students or parents applying for these loans nor has it slowed the federal government from providing these loans. In fact, the federal government has continued, as made evident with the Parent PLUS loans, to find new ways to make it possible for anyone to get a loan regardless of their inability to ever pay it back.
STUDENT LOAN DEBT: THE COPYCAT MORTGAGE CRISIS
Before the housing crisis, the federal government under Clinton and Bush made laws requiring banks to lower their standards for issuing home loans. Subprime mortgage loans were doled out to millions who were unable to repay the loans, therefore creating the greatest financial crisis in 80 years. Since the crisis, incredibly, the student loan debt has increased by 186%.
The current national debt is approximately $20 trillion. The total household debt is $12.73 trillion. The current student loan debt is $1.44 trillion. Unwittingly, trillion has become a very common number that can easily lose its significance. So consider this: on a per second basis, it would take 31,709 years to just count to a trillion. Hopefully, it won’t take nearly as long to pay off.
SOURCES:
- WALL STREET JOURNAL - https://www.wsj.com/articles/the-u-s-makes-it-easy-for-parents-to-get-college-loansrepaying-them-is-another-story-1493047388
- MARKETWATCH - http://www.marketwatch.com/story/us-households-will-soon-have-as-much-debt-as-they-had-in-2008-2017-04-03
- NERDWALLET - https://www.nerdwallet.com/blog/average-credit-card-debt-household/
- NCES - https://nces.ed.gov/fastfacts/display.asp?id=37
- EXPERIAN - http://www.experian.com/live-credit-smart/state-of-credit-2016.html
- TIME MONEY - http://time.com/money/4701506/student-loan-defaults-record-2016/
- FDIC - https://www.fdic.gov/bank/individual/failed/banklist.html
- NY FED - https://www.newyorkfed.org/microeconomics/hhdc.html
- NY FED - https://www.newyorkfed.org/medialibrary/interactives/householdcredit/data/pdf/HHDC_2017Q1.pdf
- NEW HOME SALES – https://tradingeconomics.com/united-states/new-home-sales
- EXISTING HOME SALES - https://tradingeconomics.com/united-states/existing-home-sales
- ED.GOV - https://www.ed.gov/news/press-releases/education-department-releases-college-scorecard-help-students-choose-best-college-them
- NERDWALLET - https://www.nerdwallet.com/blog/loans/student-loans/obama-student-loan-forgiveness/
- STUDENT AID - https://studentaid.ed.gov/sa/repay-loans/forgiveness-cancellation/bankruptcy
- FICO - http://www.fico.com/en/blogs/risk-compliance/us-average-fico-score-hits-700-a-milestone-for-consumers/
- POLITICO - http://www.politico.com/agenda/story/2015/06/the-us-governments-predatory-lending-program-000094
- INSIDE HIGHER ED - https://www.insidehighered.com/news/2014/10/23/us-eases-requirements-parent-plus-loans